This article will teach you how to build custom dashboards in CATCH.AI and which components you can use for this.
Dashboards are a great way to quickly and easily access the data that is most important to you. They can be customized to show the information that is most relevant to you, allowing you to quickly and easily access the data you need.
Dashboards can be tailored to show data from multiple sources, allowing you to get a comprehensive view of your data. With the right customization, dashboards can be a powerful tool for managing and analyzing data.
A dashboard is a customizable collection of widgets that can be viewed on one screen.
When working with dashboards, a good way to start is to consider:
- The purpose. What is the problem that it should help solve?
- The user. Who is going to use the dashboard?
- The metrics. What data are you going to show on the dashboard?
With those questions answered, you can start finding the data you need and add it to the dashboard.
Dashboard widgets
Widgets are the components that are put into the dashboards. They show data, buttons, video, etc.
Widgets come in various types and functionalities. You can create widgets in the dashboard builder view or export them from the report view. All widgets are shown on dashboards.
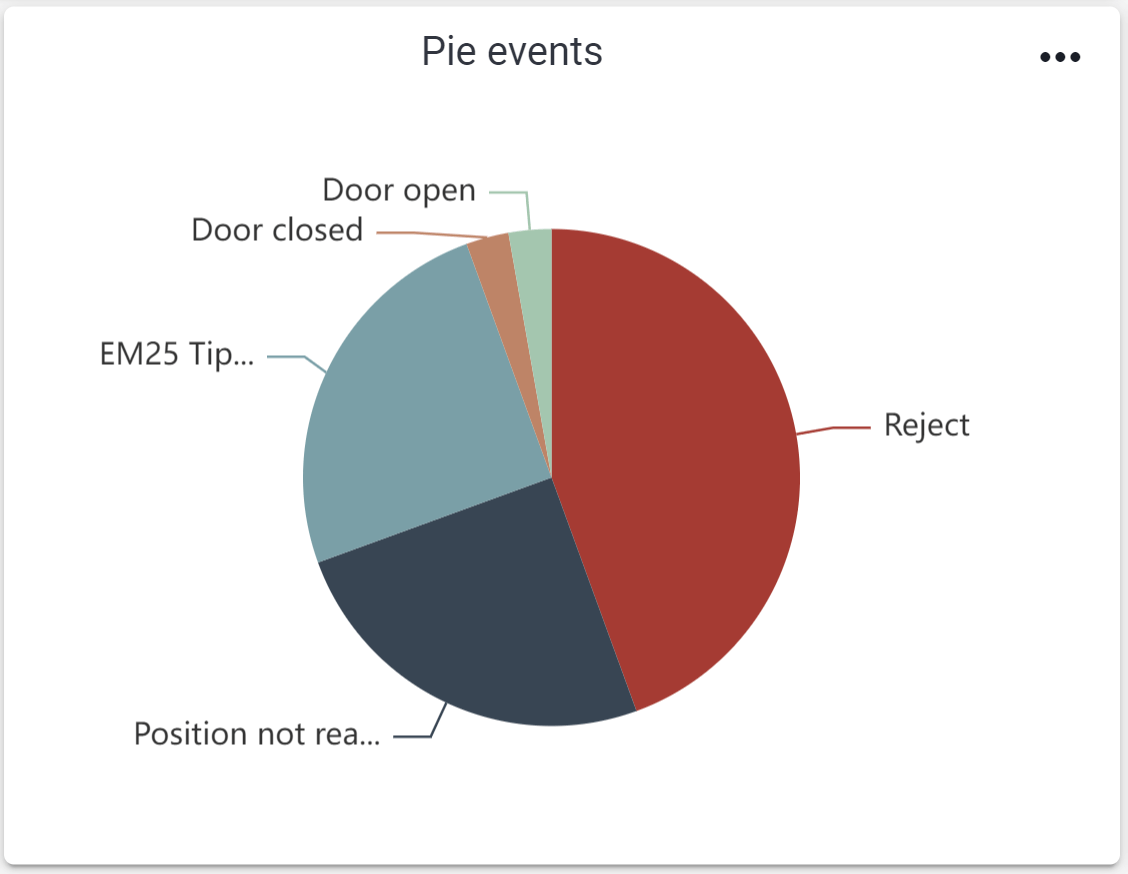
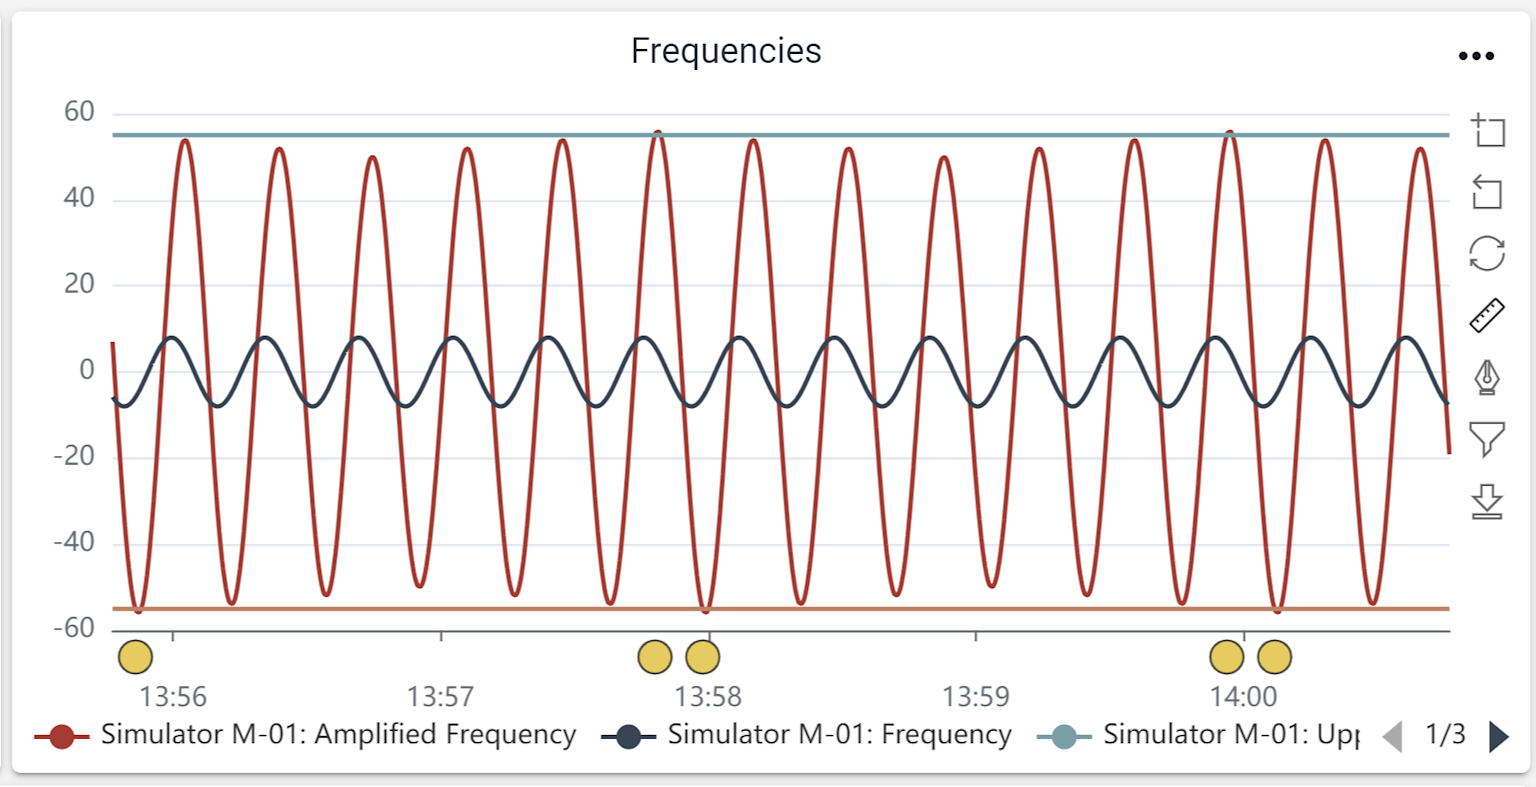
Widgets created from the report view include charts, tables, and graphs. Widgets made in the dashboard creator include buttons, text, and live video.
Use widgets to:
- Customize the look and feel of a dashboard
- Provide interactive elements that allow users to interact with the data.
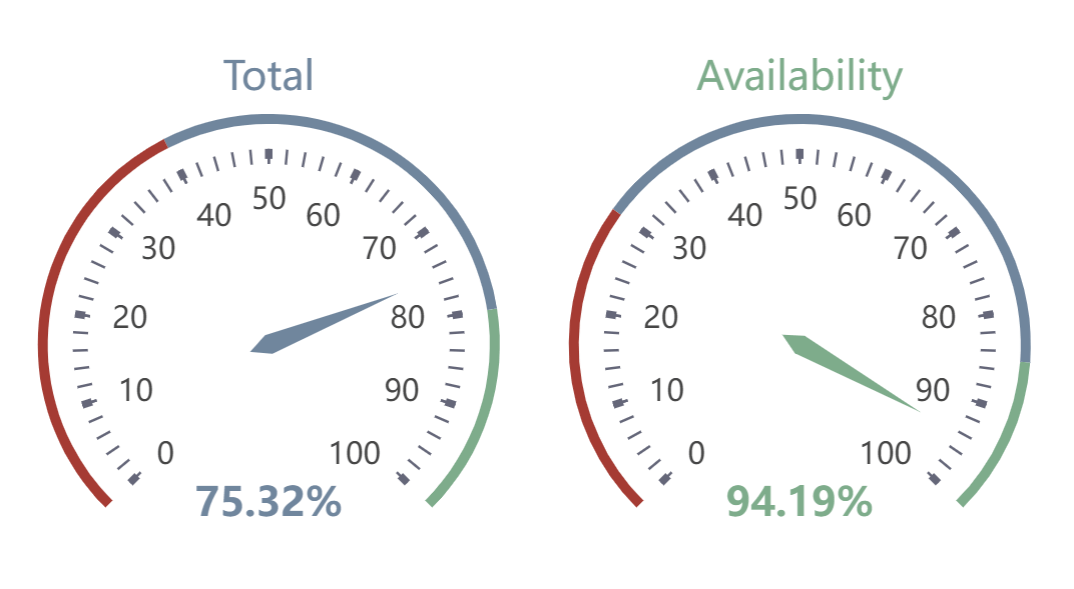
- Create custom views of data, such as a timeline view or a gauge view.
- Create custom filters, allowing users to quickly filter data based on certain criteria.
- Create custom actions, such as ingesting data.
Add a new dashboard
Creating a dashboard is a great way to organize and visualize data. To add a new dashboard, first select the “Dashboards” tab from the main navigation bar. Then click the “New” button. This will open a new window where you can enter a name for the dashboard. Once you have filled out the name, click the “Create” button to save the dashboard. Your new dashboard will now be available for you to customize and use.

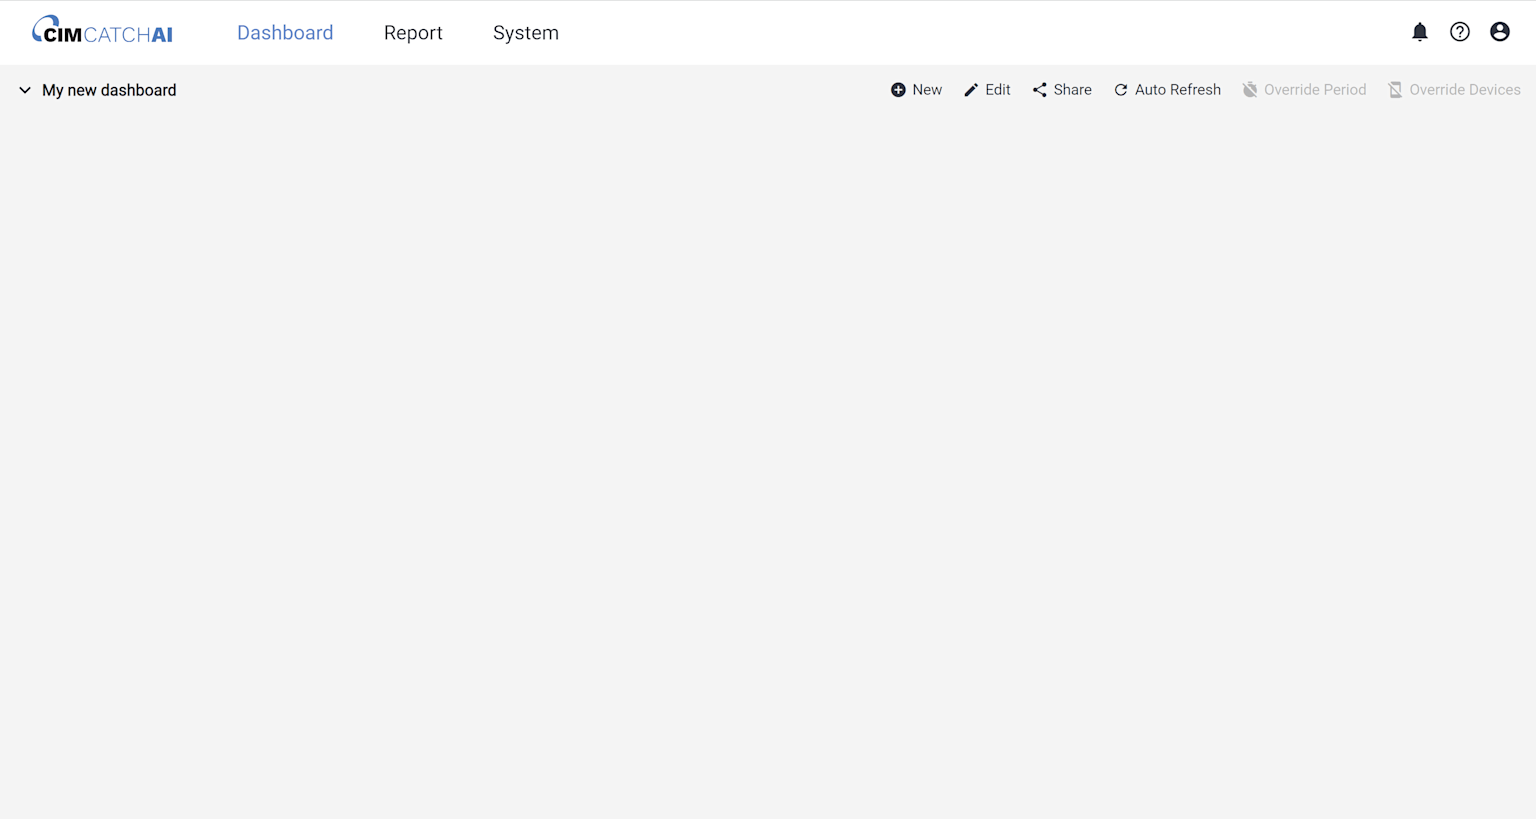
An empty dashboard ready for customization
Add a report widget
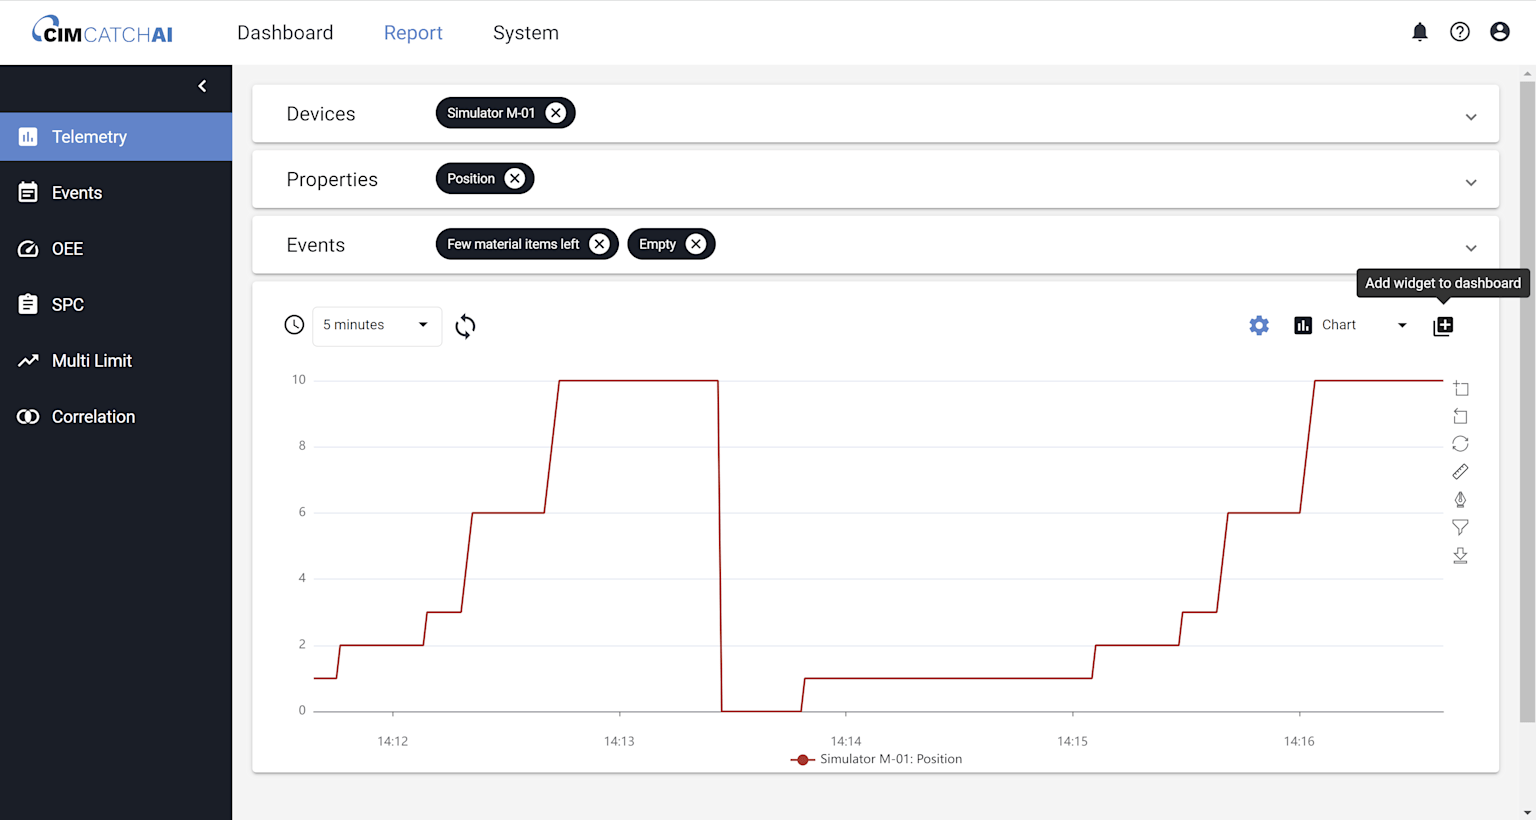
To add a report widget, start by going to the Report tab.
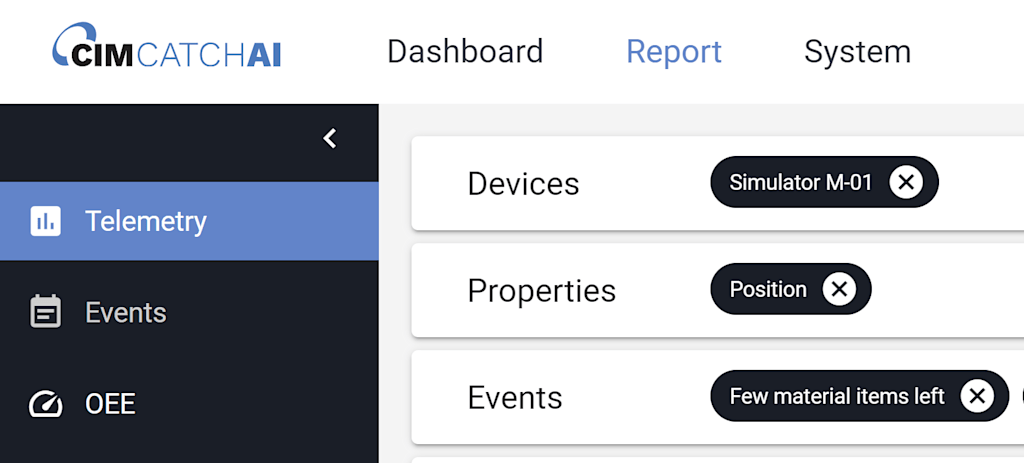
From here, create the chart/widget that you would like to add to your dashboard.


Add a dashboard widget
To add a dashboard widget, start by going to the Dashboard tab.
Find the dashboard that you want to add the widget to and press "Edit"
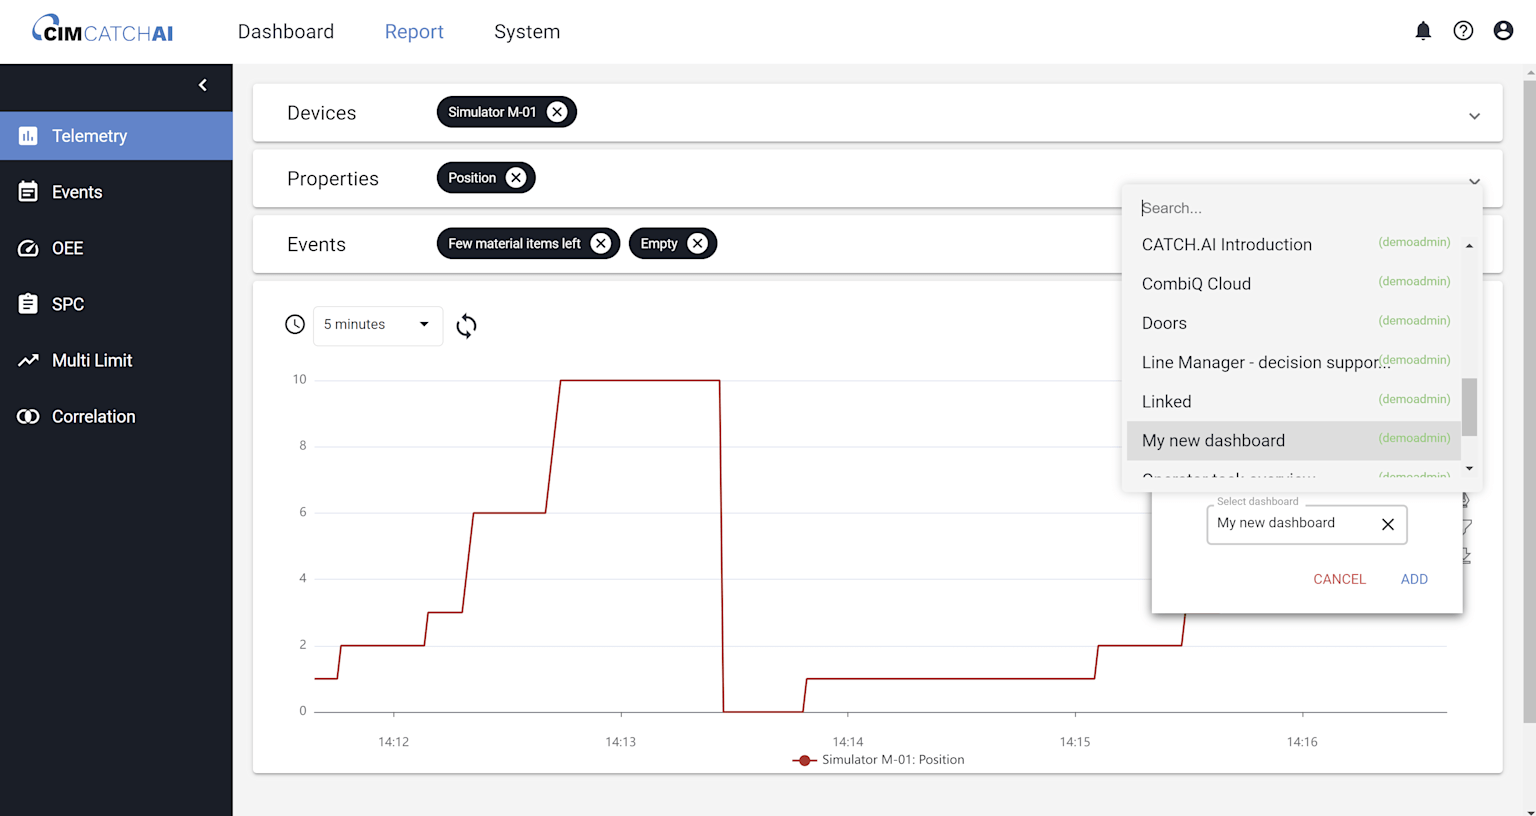
This will open a menu where you can select a widget type
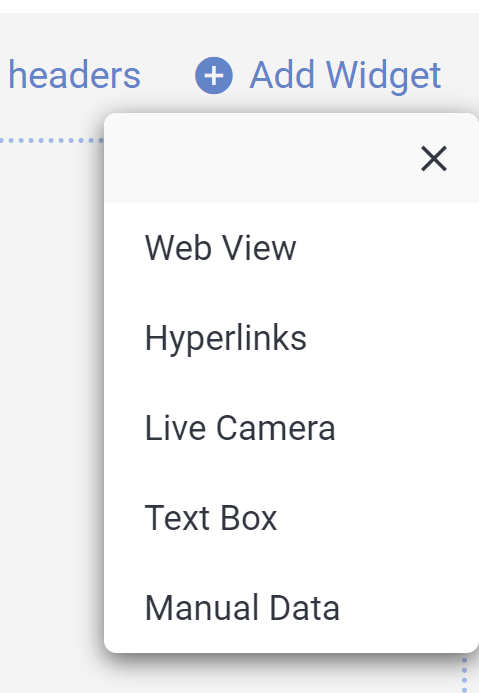
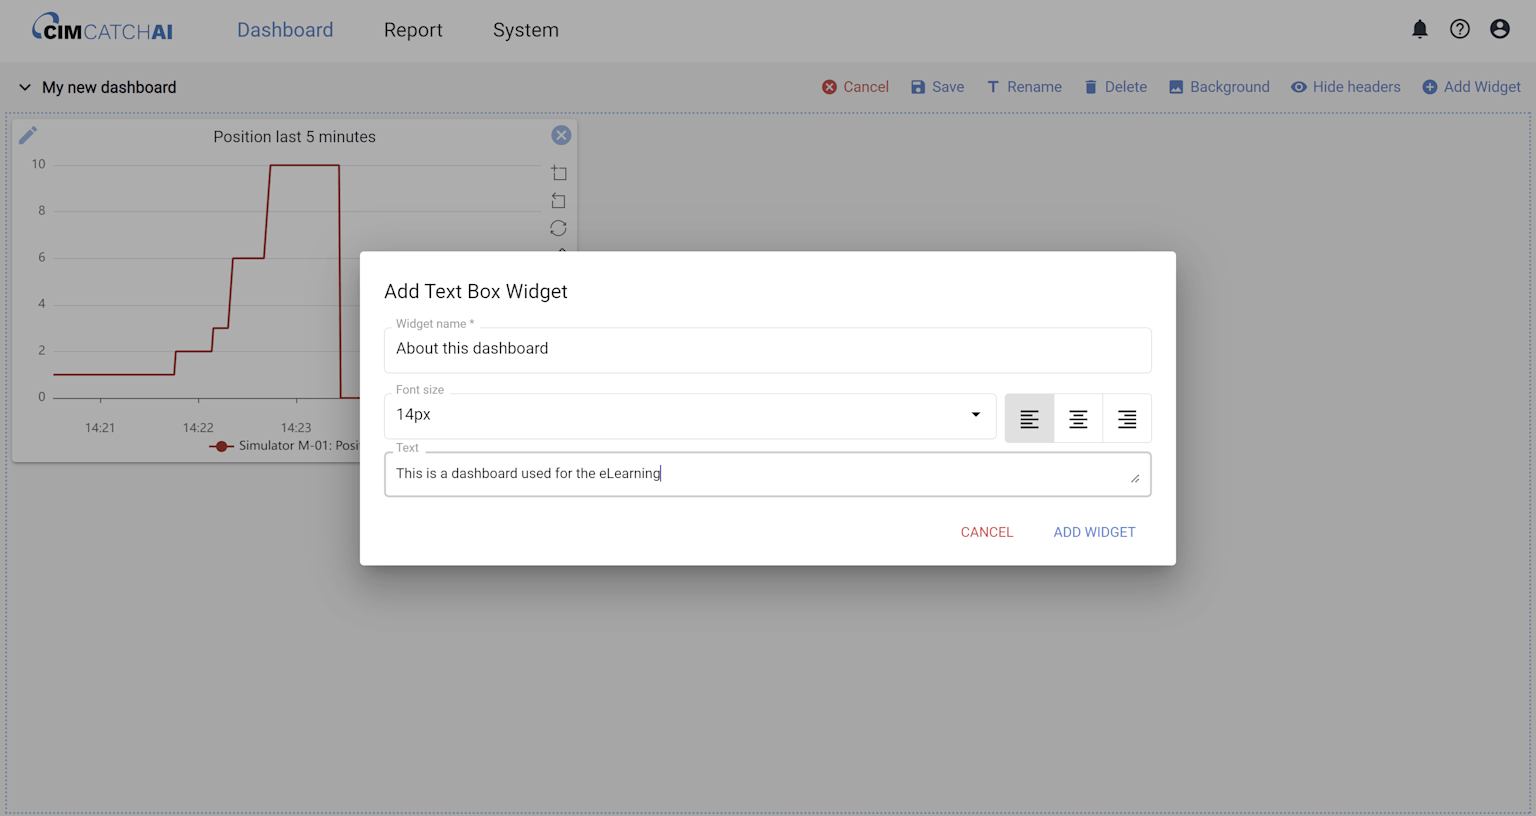
Finally, you can press "Save" to save the changes to the dashboard. Your new widget will now appear on the dashboard.

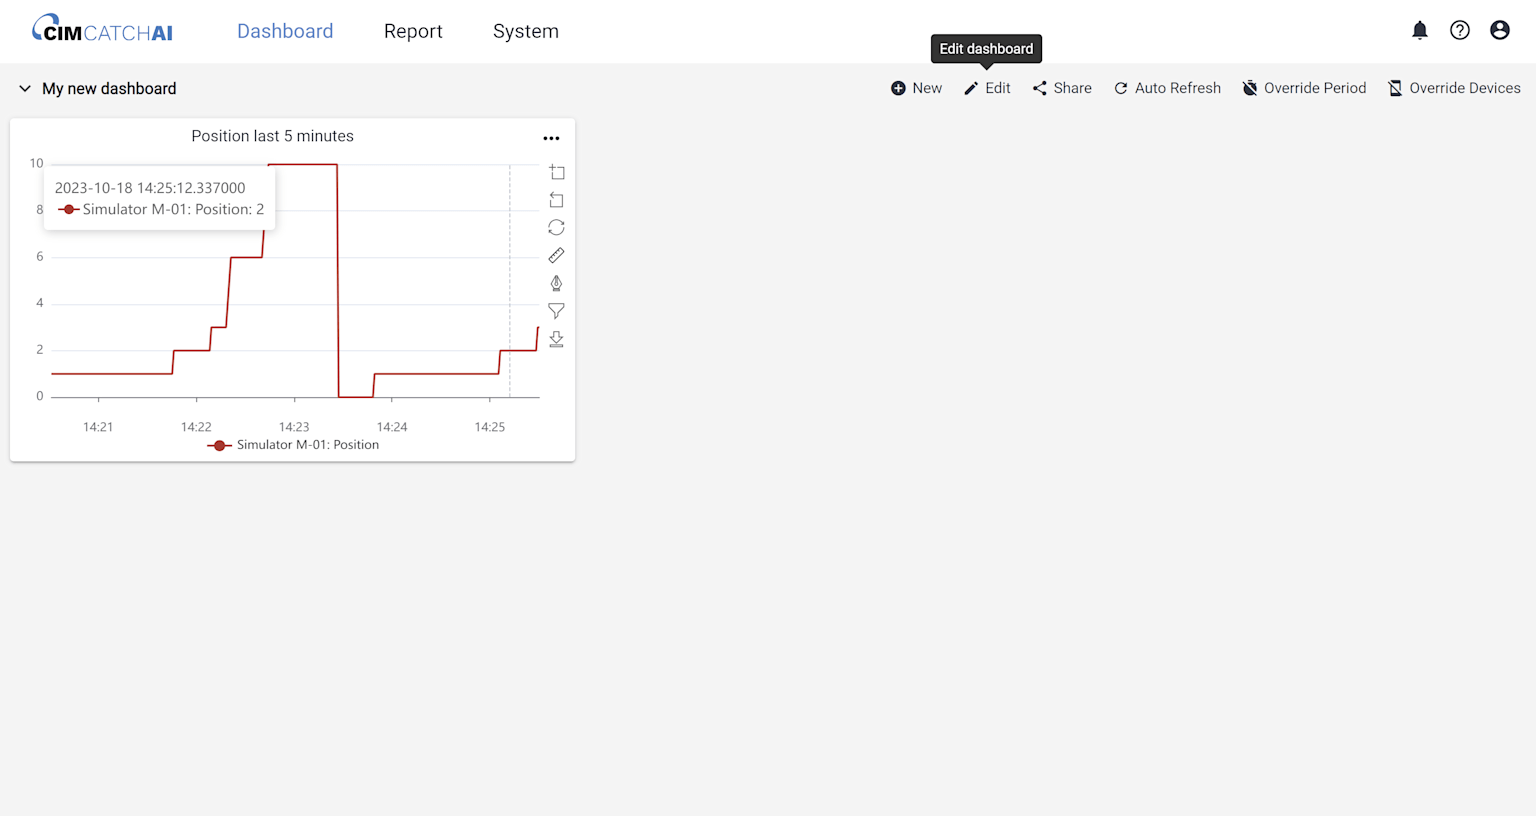
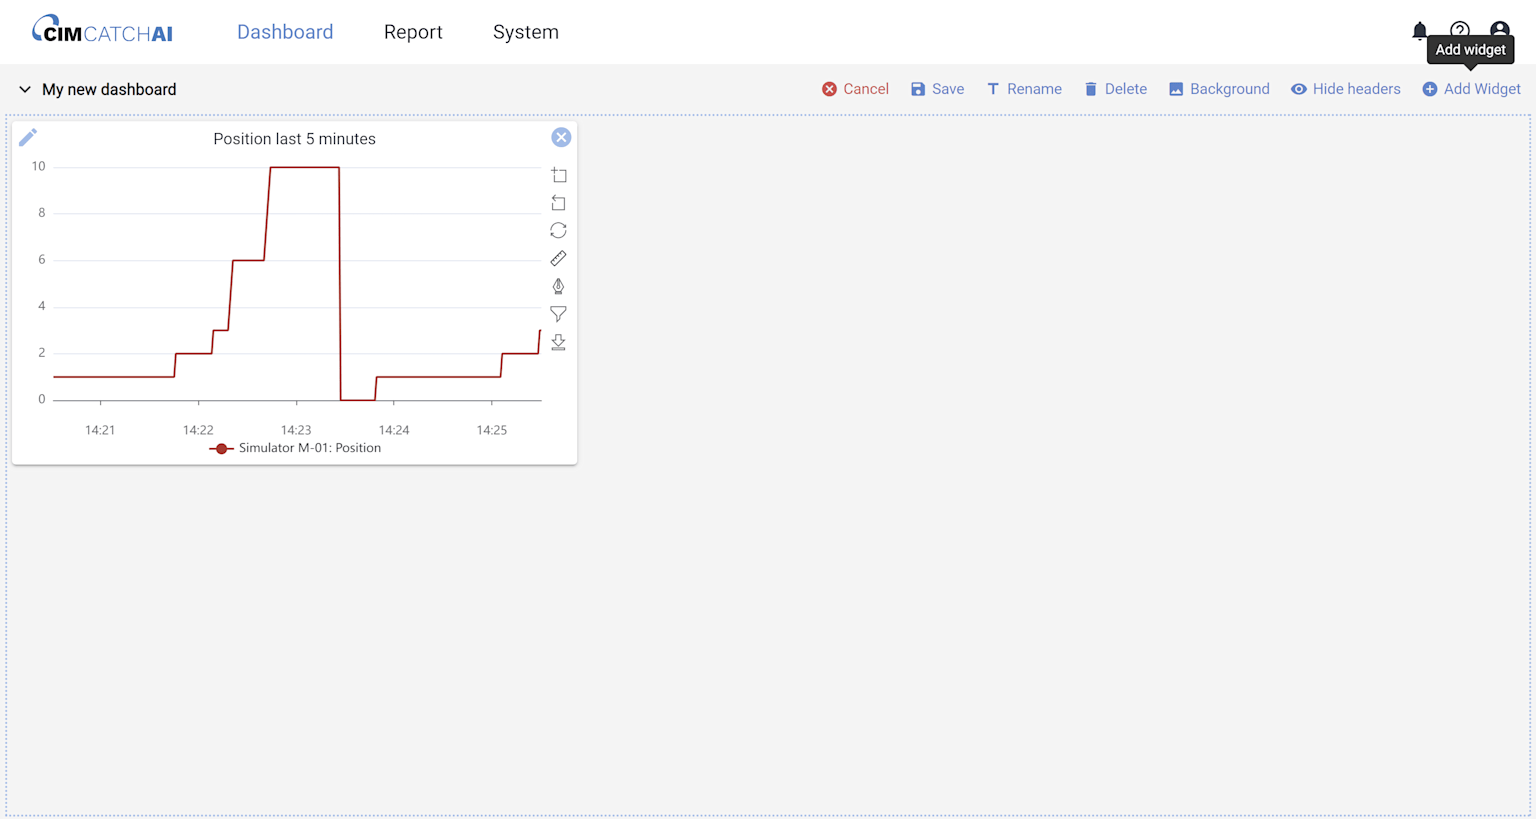
Edit and adjust dashboard
By default, the system will just add the widgets anywhere on the dashboard where there is room. However, you can adjust the size and position of the widgets as you would like.
Start by going to the dashboard and press "Edit"


When you are done, click "Save" to save your changes.
When you are in Edit mode you can also do further customization to the dashboard, such as:
- Rename the dashboard
- Add a background image to the dashboard
- Hide the widget headers
- Hide the widget background
- Cancel the changes you have made since you entered Edit mode
- Delete the dashboard
Tips and tricks
Here are a few tips and tricks from the developers!
- You can add an image of the machine/line as the dashboard background and place widgets on the position where the data is from.
- When you are on a dashboard you can overwrite the devices that data is shown for. This can be used to avoid duplicating dashboards and instead use the same dashboard for multiple devices.
- You can navigate to the report menu directly from a widget on a dashboard. This will change the selections and settings to the same as is used in the chart. This can be used to store specific device/property/event selections.